
SCHD Dividend Calculator
How SCHD Dividend Income Compounds With DRIP — Plus Taxes and Inflation
SCHD (Schwab U.S. Dividend Equity ETF, NYSE Arca: SCHD), issued by Charles Schwab Asset Management, is a U.S. dividend growth ETF that tracks the Dow Jones U.S. Dividend 100 Index, requiring at least 10 consecutive years of dividend payments and ranking eligible companies on a composite score of cash flow, profitability, yield, and dividend growth.
This calculator projects your SCHD dividend income, yield on cost, and year-by-year portfolio and share growth — modeling how DRIP reinvestment compounds returns over time.
Calculate SCHD Dividend Income and DRIP Growth
Model your investment using the latest available SCHD share price and dividend data, with DRIP reinvestment for compounding growth, tax and inflation settings, and recurring contributions for a more complete projection.
Latest SCHD Share Price
Live market data
Expense Ratio
0.06%
Dividend Frequency
Quarterly
Current Yield
Calculated from price
Calculator Inputs
- Share Price ($)
- Initial Investment ($)
- Investment Period (Years)
- Quarterly Dividend Per Share ($)
- Dividend Growth Rate (%)
- Price Growth Rate (%)
- Contribution Amount ($)
- Contribution Frequency
- Annual Contribution Increase (%)
- Enable DRIP (Dividend Reinvestment)
- Adjust for Inflation
- Dividend Tax Settings (Optional)
Latest market data is fetched through third-party financial data providers, including Alpha Vantage. Values may be delayed or unavailable during provider outages.
How SCHD Dividend Income and Net Returns Are Calculated
The SCHD Dividend Calculator estimates future income by converting your investment amount into projected SCHD shares, then applying dividend per share, dividend growth, reinvestment, contribution, tax, and inflation assumptions year by year. The goal is to show both income potential and net portfolio value, not just a simple dividend yield estimate.
Dividend and share price data used in these projections come from third-party financial data providers and are updated regularly; historical dividend growth reflects SCHD's actual track record under the Dow Jones U.S. Dividend 100 Index's four-factor ranking system (cash flow to debt, return on equity, dividend yield, and 5-year dividend growth).
SCHD Payout Schedule, Yield, and Ex-Dividend Dates
SCHD generally distributes dividends quarterly. Because the ETF share price and dividend amount change over time, the dividend yield shown by any calculator is an estimate based on the selected share price and dividend input.
Ex-dividend dates are important because an investor must own SCHD before the ex-dividend date to receive the next scheduled distribution. This calculator does not predict future ex-dividend dates; it uses the dividend amount entered in the form to estimate annualized income and long-term compounding. For the current ex-dividend date and full payout history, see the SCHD Dividend History page.
SCHD Dividend Income Formula
SCHD dividend income is estimated from the number of shares owned and the annual dividend per share. The calculator first estimates shares from your starting investment and share price, then applies dividend growth assumptions across each projection year.
Shares owned
Investment amount / SCHD share price
Annual dividend income
Shares owned x annual dividend per share
Quarterly dividend estimate
Annual dividend income / 4
Monthly average income
Annual dividend income / 12
Yield on cost
Annual dividend income / total invested capital
How DRIP Reinvestment Compounds Your Shares
When DRIP is enabled, projected dividend payments are reinvested into additional SCHD shares instead of being treated only as cash income. Those additional shares can generate more dividend income in later periods, creating a compounding effect over time.
The DRIP estimate depends on the projected share price, dividend amount, and dividend growth rate used in the calculator. Actual reinvestment prices may differ from the projection because market prices change throughout the year. For historical reference, see SCHD's historical dividend growth data.
How Recurring Contributions and Annual Increases Are Modeled
Recurring contributions are added on the schedule selected in the calculator: weekly, monthly, quarterly, or annually. Each contribution is converted into additional SCHD shares using the projected share price for that year.
If an annual contribution increase is applied, the recurring contribution amount rises by the selected percentage each year. This helps model a growing investment plan where contributions increase over time instead of staying fixed.
How Taxes and Inflation Affect Projected Returns
The calculator separates gross dividend income from after-tax dividend income when tax settings are enabled. This helps estimate how much dividend income may remain after applying the selected qualified dividend tax assumptions. SCHD distributions may generally include qualified dividends taxed at 0%, 15%, or 20% depending on taxable income and filing status — see the FAQ below for details.
Inflation adjustment estimates the future purchasing power of the projected portfolio value. Nominal portfolio value shows the future dollar amount, while inflation-adjusted value gives a closer view of what that future value may be worth in today's dollars.
SCHD Dividend Calculator is an independent tool built to help investors model SCHD dividend income and DRIP growth. This site is free to use and supported by advertising. Dividend and price data are checked against Charles Schwab Asset Management's official published figures. Have a correction or question? Contact us.
How to Use the SCHD Dividend Calculator
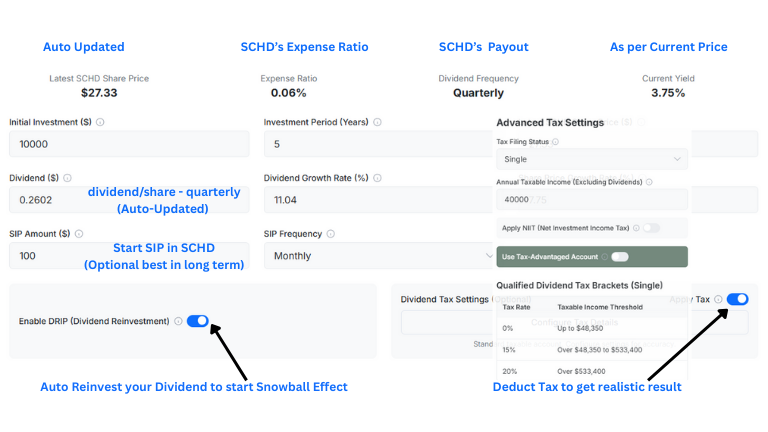
Follow this step-by-step guide to estimate your SCHD dividend income, recurring contributions, DRIP growth, and long-term portfolio value.
Step 1: Enter Your Initial SCHD Investment Amount

Easily input your SCHD investment parameters to begin calculating potential growth.
Enter the Initial Investment you're starting with. You can also adjust the Latest SCHD Share Price if needed, though it defaults to the current market price.
Step 2: Set Dividend, Yield, and Growth Assumptions

Customize your investment scenario by defining key growth assumptions in the SCHD dividend calculator.
Adjust the Dividend Growth Rate (%) and Share Price Growth Rate (%). The calculator uses 10-year historical averages as a baseline, but you can input your own estimates.
Step 3: Add Recurring Contributions and Annual Increases

Model recurring contributions with a selected schedule and optional annual contribution increase.
If you plan to invest regularly, enter a Contribution Amount ($) and select the Contribution Frequency, such as weekly, monthly, quarterly, or annually. Use the Annual Contribution Increase (%) field to increase your recurring contributions each year.
Step 4: Choose DRIP, Taxes, and Inflation Settings

Configure your investment plan by enabling DRIP, applying dividend tax calculations, and adjusting for inflation.
Enable DRIP (Dividend Reinvestment) to model dividend compounding. For a more realistic projection, enable Apply Tax and configure the settings. You can also Apply Inflation Adjustment to view inflation-adjusted portfolio value in today's dollars.
Step 5: Review Your Dividend Income and Portfolio Projection

Calculate your SCHD dividend income and portfolio growth projection.
Click "Calculate Growth" to see your projection. The results include a detailed summary with inflation-adjusted values, an interactive chart, and a year-by-year breakdown.
Tips for More Realistic SCHD Projections

- Be Realistic: Past performance isn't a guarantee of future results. Consider a range of growth rates to create optimistic, pessimistic, and moderate scenarios.
- Factor in Taxes and Inflation: If you're using a taxable account, enabling the tax settings and inflation adjustment will give you a much clearer picture of your potential net returns and purchasing power.
- DRIP Reinvestment: For long-term investors, dividend reinvestment can increase share count and future dividend income over time.
- Stay Consistent: Regular contributions, even small ones, can significantly boost your portfolio's value over the long run.
SCHD Historical Dividend Analysis
Review recent SCHD dividend dates, payout amounts, yield context, and historical distribution patterns before opening the full SCHD Dividend History page.
SCHD Quarterly Dividend and TTM Yield — Historical Chart
SCHD's quarterly dividend has grown steadily since 2011, while its trailing twelve-month (TTM) yield has stayed within a relatively stable range. Toggle between 1, 5, 10 years, or full history using the buttons above.
Recent SCHD Dividend Payments
SCHD has paid a growing dividend since its inception in 2011. Below are the most recent payments. Check the complete table of historical ex-dividend dates and payout amounts in the history page.
| Ex-Dividend Date | Record Date | Payable Date | Amount Per Share |
|---|---|---|---|
| 06/24/2026 | 06/24/2026 | 06/29/2026 | $0.2525 |
| 03/25/2026 | 03/25/2026 | 03/30/2026 | $0.2569 |
| 12/10/2025 | 12/10/2025 | 12/15/2025 | $0.2782 |
| 09/24/2025 | 09/24/2025 | 09/29/2025 | $0.2604 |
| 06/25/2025 | 06/25/2025 | 06/30/2025 | $0.2602 |
| 03/26/2025 | 03/26/2025 | 03/31/2025 | $0.2488 |
* TTM yield is calculated by dividing total distributions over the trailing 12 months by the SCHD share price at that time.
* Past dividend distributions do not guarantee future dividend payments. Data is sourced from official SEC filings and Charles Schwab database updates.
SCHD Calculator Features
The SCHD Dividend Calculator models dividend income, DRIP reinvestment, recurring contributions, and portfolio growth — giving you a year-by-year view of how your investment compounds over time.
Dividend Income Projection and Yield Estimates
See projected SCHD dividend income and yield estimates for each year — built on current TTM dividend data, your share price, and chosen growth rate.
DRIP Reinvestment and Compounding Growth
Each quarterly dividend is reinvested to buy more SCHD ETF shares — compounding your returns automatically with every payout.
SCHD Snowball and Future Value Projection
Projects total portfolio value over your chosen investment period — combining price appreciation, dividend income, and DRIP compounding into one forward view.
Recurring Contributions with Annual Growth Options
Add contributions on your schedule — weekly, monthly, quarterly, or annually — with an optional annual increase rate to model a growing long-term investment plan.
Tax-Aware Dividend Estimates
Applies estimated qualified dividend tax rates based on your filing status and income bracket — showing after-tax dividend income alongside gross estimates.
Inflation-Adjusted Portfolio Value
Adjusts the projection for inflation — showing the real value and purchasing power of your future portfolio, not just nominal growth.
Year-by-Year Breakdown and PDF Report
Full year-by-year table — shares, dividend income, yield on cost, and portfolio value — for your complete dividend projection. Downloadable as a PDF.
Disclaimer: All projections are hypothetical and not a guarantee of future performance. This tool is for informational and educational purposes only.
COMMON QUESTIONS
SCHD Dividend Calculator FAQ
How is SCHD dividend income calculated?
SCHD dividend income is estimated by multiplying the number of SCHD shares owned by the dividend paid per share. The basic formula is: annual dividend income = shares owned x annual dividend per share. The calculator uses your investment amount, SCHD share price, dividend assumptions, and growth rate to project future dividend income over time.
What is DRIP and how does it work with SCHD?
DRIP stands for Dividend Reinvestment Plan. When DRIP is enabled, estimated SCHD dividend payments are reinvested to buy additional SCHD shares instead of being taken as cash. More shares can generate more future dividends, which creates a compounding effect over time.
What dividend growth rate should I use for SCHD?
A conservative SCHD dividend growth assumption may use a lower rate, such as 6% to 8%. A moderate assumption may use 9% to 11%. Historical-rate modeling can use SCHD's recent dividend CAGR, but past dividend growth does not guarantee future increases. You can adjust the dividend growth rate in the calculator to compare conservative, moderate, and optimistic scenarios.
Are SCHD dividends qualified?
SCHD distributions may generally include qualified dividends for U.S. investors who meet IRS holding-period requirements. Qualified dividends are usually taxed at 0%, 15%, or 20%, depending on taxable income and filing status. Final tax treatment can vary, so investors should verify their tax forms or consult a tax professional.
How much do I need to invest in SCHD to make $1,000 per month?
To estimate the investment needed for $1,000 per month, first convert the goal to annual income. $1,000 per month equals $12,000 per year. Then divide $12,000 by SCHD's current dividend yield. Because SCHD pays dividends quarterly and its yield changes with price and payout data, the result should be treated as an estimate.
Does SCHD pay dividends monthly?
No. SCHD typically pays dividends quarterly, not monthly. Monthly income shown in the calculator is an average estimate calculated by dividing projected annual dividend income by 12.
How much will my SCHD investment be worth in 10 years?
A 10-year SCHD projection depends on your starting investment, recurring contributions, dividend growth rate, share price growth rate, taxes, inflation, and whether DRIP is enabled. The calculator combines these assumptions to estimate year-by-year portfolio value, dividend income, and reinvestment growth.
What should a good SCHD dividend calculator include?
A good SCHD dividend calculator should estimate dividend income, average monthly income, DRIP reinvestment, recurring contributions, dividend growth, taxes, inflation, and year-by-year portfolio value. It should also show the assumptions behind the result so users can adjust the numbers instead of relying on a fixed projection.